This is an old revision of the document!
Table of Contents
Electrodermal Activity (EDA)/Galvanic Skin Response (GSR)
Summary
Electrodermal activity (EDA) is a type of biosignal (electrical signal produced in the body) which refers to the variable electrical characteristics of the skin. EDA is now the standard umbrella term for what has historically been known as galvanic skin response (GSR), electrodermal response (EDR), psychogalvanic reflex (PGR), skin conductance response (SCR), sympathetic skin response (SSR), skin conductance level (SCL), and skin conductance (SC). This article will favour the use of the term EDA.
EDA is an easy-to-measure and generally reliable measurement commonly used in psychophysiological studies. The signal is sensitive to changes in mental state and cognitive processes. It has the advantages of being convenient and economical, and can be applied in both laboratory and real-world settings. EDA is commonly used in psychophysiological studies to measure activations of the sympathetic nervous system, emotional arousal, and cognitive phenomena such as stress and cognitive load. It should be noted that there is is not absolute agreement on exactly what EDA measures psychophysiologically, and it is best to consider EDA measurements as indicators of general arousal, rather than indications of specific emotional states. EDA signals tend to spike when a person is startled, stressed, or experiencing anxiety.
EDA measurements are often combined with other physiological measurements such as blood pressure, heart rate, and respiration rate. This is an important consideration as EDA responses are often but one of many psychophysical phenomena occurring in response to activation of the autonomic nervous system.
Origins, Theory, & Physiology
EDA measurement has a long history, dating back to experiments conducted by DuBois-Reymond in Germany in the mid-1800s, in which individuals placed hands or feet into a zinc sulphate (ZnSO4) solution. DuBois-Reymond observed a current flowing from a resting limb to a limb contracted by the participant, and attributed this to muscular action potentials. In 1881, Hermann repeated this voluntary movement experiment, noting that areas with stronger sweating response showed a higher magnitude electrical current, providing a link between sweat glands and electrodermal phenomena. These phenomena were further studied by numerous other researchers during the 19th and 20th centuries.
While the exact origins and physiological mechanisms of EDA are complex and still being investigated, three principal physiological theories offer accounts for for the basis of EDA phenomena: muscular activity, vascular changes, and secretory changes. Out of these three theories, the first two are primarily supported by correlational evidence, while the strongest support for a causal relationship is related to secretory changes.
Traditional EDA theory links changes in electrical resistance of the skin with sweat glands controlled by the sympathetic branch of the autonomic nervous system (responsible for many of the body’s physiological responses). Increased activation of the sympathetic nervous system leads to increased sweat gland activity, which, in turn, leads to increased skin conductance (and decreased skin resistance). Conductance is affected by the number of active sweat glands, the amount of sweat in each gland, and the amount of sweat which overflows from the glands onto the surface of the skin. Within the sweat glands, sweat ducts act as variable resistors in parallel.
It should be noted that different areas of skin on the human body display different electrical characteristics due to the distribution of sweat glands. Different types of sweat glands exist as well, although eccrine sweat glands are of primary interest in EDA, as this type of gland is closely related to psychological stimulation. Non-eccrine sweat glands are more closely related to temperature regulation. Eccrine glands are most prevalent in the hands and feet.
Electrodermal Measurement Principles & Data Components
Measurement of EDA is based on the fundamental electrical principle of Ohm’s Law (V = IR), which states that the current (I) flowing through a conductor between two points is directly proportional to the voltage (V) across the two points and inversely proportional to the resistance (R) of the conductor. If current is held constant between two electrodes, voltage will vary in proportion to the varying resistance of the skin, producing an output proportional to skin conductance. Likewise, if voltage is held constant between two electrodes applied to the skin, the current will vary in proportion to the varying resistance of the skin, producing an output proportional to skin resistance.
Skin electrical activity can be measured using endosomatic or exosomatic methods.
Endosomatic methods measure potential differences at various points on the skin surface without application of external electrical current. Endosomatic methods are not commonly used, given that they often produce bipolar signals that are complex waveforms, rendering the measurements taken difficult to score and interpret.
Exosomatic methods use an external electrical source to pass a small alternating current (AC) or direct current (DC) through the skin to measure the electric resistance to this current. The most commonly used method is an exosomatic one in which skin conductance (the reciprocal of skin resistance) is measured. Generally, exosomatic methods that use DC are most commonly used, and measurement of skin conductance is more common than measurement of resistance.
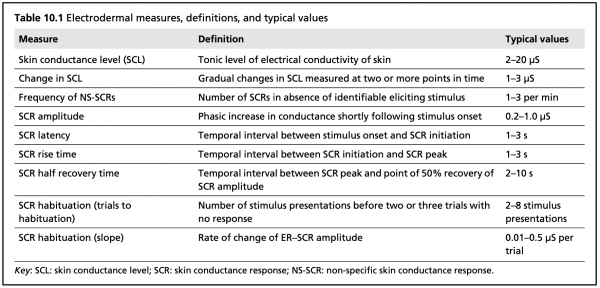
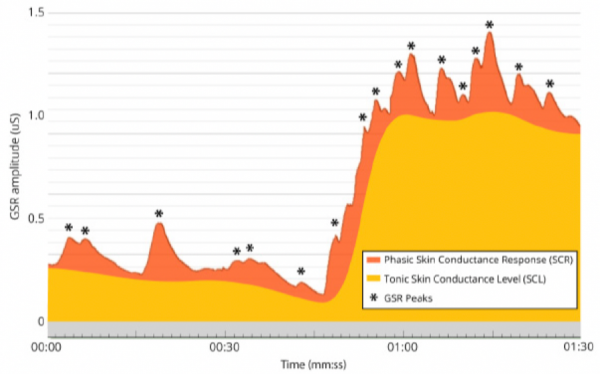
EDA data consists of two primary components: Tonic Skin Conductance Level (SCL) and Phasic Skin Conductance Response (SCR).
SCL shows patterns of slow variation over tens of seconds to minutes, and is constantly changing based on individuals’ hydration, skin moisture, and autonomic regulation. SCL varies notably across individuals, and may not be useful when examined independent of SCR.
SCR alternates more quickly, showing characteristic EDA bursts or peaks (Event-Related SCR; ER-SCR), and is sensitive to emotional stimulus events. Peaks typically follow the presentation of emotional stimuli within the range of 1 to 5 seconds. SCR can also be spontaneous, non-specific, and unrelated to external stimuli. These spontaneous responses (Non-Specific SCR; NS-SCR) occur approximately one to three times per minute.
Typical electrodermal measures, definitions, and values (Dawson et al., 2012)
Phasic & Tonic Conductance Components (iMotions, 2017)
Measuring EDA
EDA is measured using two electrodes placed on the surface of the skin, often in the form of a patch sticker (which requires conductive gel) or embedded within a velcro strap. Electrodes are often made of Silver/Silver-Chloride (Ag/AgCl; most common) or Zinc/Zinc Sulphate (Zn/ZnSO4). The Ag/AgCl electrode pair is reversible, minimizing concerns related to bias potentials and polarization, which could potentially induce artifacts in the output signal.
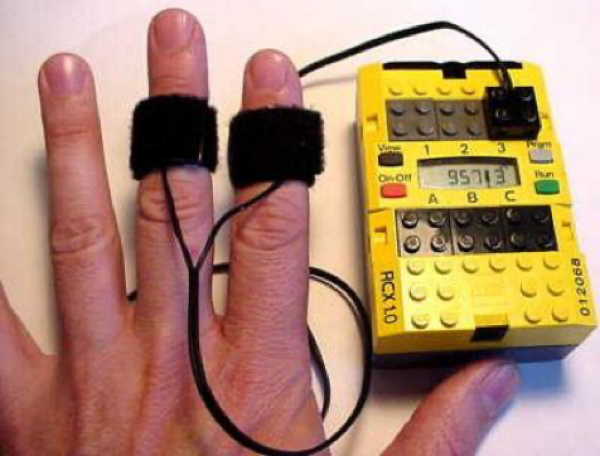
EDA sensors typically include two electrodes, an amplifier to increase signal amplitude, and an analog-to-digital converter. Wireless sensor systems will also contain modules for data transmission. Various sensors exist with different technical specifications, sensor placement options, and software compatibility. While some systems will allow arbitrary sensor placement, others will be more restrictive, such as those in which electrodes are embedded in finger or wrist straps. Sensors have even been created using the LEGO MINDSTORMS robotics system.
EDA measurement using LEGO MINDSTORMS (Sharma et al., 2016)
EDA sensors are often combined with other biometric sensors such as eye tracking, facial expression analysis, electroencephalography, electromyography, and electrocardiography in larger sensing interfaces. These multi-sensing devices can provide more detail related to individual experience and psychophysical response than EDA alone.
EDA Sensor Setup & Calibration
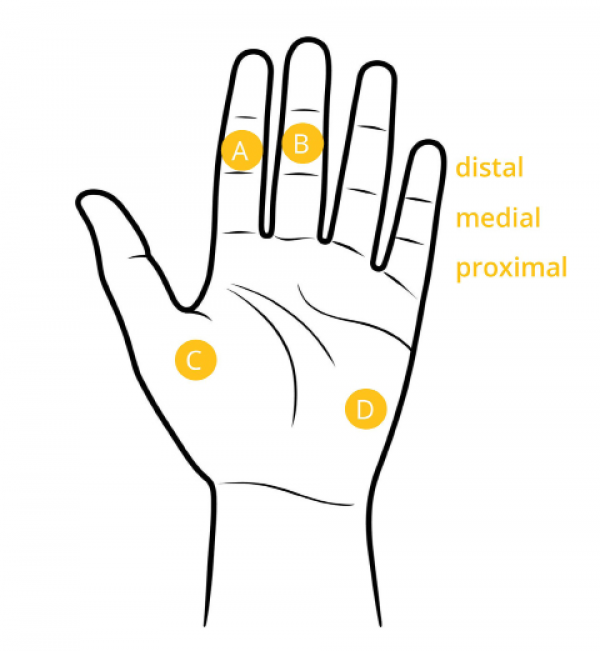
The areas of skin most responsive to emotional stimuli are good candidates for EDA measurement electrode placement. These areas include the fingers, the palms of the hands, and the soles of the feet. In a study of EDA electrode placement on different parts of the body, Van Dooren et al. (2012) suggest a number of other positions for electrodes, including the forehead, shoulders, neck, calf, wrist, and chest, which may be more suitable for situations in which an individual is ambulatory.
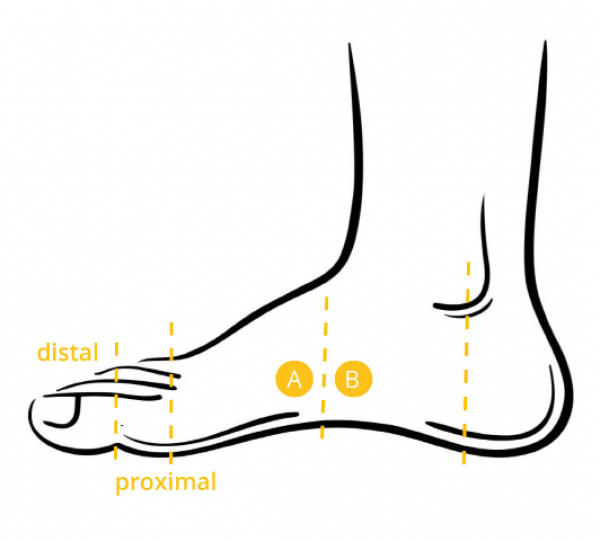
When placing electrodes on the fingers, it is common to take measurements from the index and middle finger of an individual’s non-dominant hand, such that the individual can still perform tasks with their dominant hand. In cases where users require full use of both hands, electrodes placed on the palm can be a good choice. When individuals must use both hands extensively, it can be preferable to take measurements from the feet. In these cases, electrodes should be placed on the side of the foot since the soles can be significantly affected by pressure when individuals are standing or walking.
Electrode placement for palm and fingers (iMotions. 2017)
Electrode placement for the sole of the foot (iMotions, 2017)
It can also be useful to treat the skin area where the electrodes are to be applied. In cases of oily skin, it can be useful to use 70% isopropanol for cleaning to optimize sensor stability. In cases of very dry skin, adding skin moisturizer can be beneficial.
During setup, a baseline period of two to four minutes should be included at the beginning of data recording to allow identification of issues related to skin moisture and environmental conditions, and to establish a baseline for comparison. During this period, no stimuli are presented, and individuals should sit in a relaxed posture with closed eyes. This baseline consists of only the non-specific and tonic level skin conductance response. A second baseline period should measure EDA while presenting individuals with both highly positive and highly negative stimuli. This should provide the full range of an individual’s EDA response.
In order to avoid muscular artifacts, individuals should breathe normally, minimize unnecessary limb movements, and avoid talking. They should be seated in a comfortable position with feet flat on the ground, thighs parallel to the floor, and adequate lumbar support.
For circumstances in which EDA measurement quality is adversely affected by vigorous movement, Westyn et al. (2006) developed a galvanic-skin response accelerometer (ActionEDA), designed to separate desired signals from extraneous motion artifacts.
Sensor Use Considerations
Boucsein (2012) suggests a standard methodology for skin conductance recording using a Silver/Silver Chloride (Ag/AgCl) electrode pair with an electrode surface area of 0.5 cm2 to 1 cm2. This methodology uses DC with a 0.5 V constant voltage or a constant current of 10 μA/cm2.
EDA measurements can be affected by a number of technical, environmental, and individual factors including density of applied current, electrode composition and size, contact medium, electronic circuitry, ambient temperature, skin temperature, skin cuts, and abrasions. These factors can contribute additional variance to the EDA output signal, and should be considered and controlled for, if possible.
Technical considerations relate to sample rate, sources of electrical noise, and whether or not a system is wireless.
Very low sampling rates (1 to 10 Hz) are often sufficient for EDA measurement, though higher sampling rates are often used, particularly in cases where a single device is collecting other physiological measurements which require a higher sample rate at the same time.
In most electrode-based biosignal interfaces, stray capacitance and stray inductance from a number of sources can cause undesirable electrical noise in the interface output. Extraneous noise due to power mains interference can be reduced through use of proper grounding, shielded cables, maintaining approximately equal electrode impedances, ensuring these impedances are low, and maintaining distance between electrode leads and power mains cables.
When using wireless sensing systems, it is essential to ensure that the transmitter and receiver are within the recommended range for the entire duration of measurement. Bluetooth signals can also be occluded by water, concrete, or human tissue.
Since EDA bursts typically occur with a delay of 1 to 5 second from the stimulus presentation, it is important that individuals are given a long enough window to process stimuli and show a response. It can also be useful to present neutral stimuli in between stimuli designed to evoke a response in order to allow skin conductance to return to baseline. As EDA is a relatively slow moving response, it may not be useful in situations where measurement of more rapid response is required.
Individual differences in skin response are also important to consider, as individuals experience psychological phenomena differently, leading to differing psychophysical responses. For this reason, it is useful to collect data that establishes a baseline for an individual’s skin response. It is also good practice to control for individual differences across experimental conditions in experimental settings.
Habituation is another important consideration when taking EDA measurements. This describes the phenomena of declining responsiveness to familiar or non-significant stimuli presentations over time. A number of methods exist for quantifying habituation.
Some individuals possess a trait known as electrodermal lability, which refers to a high rate of non-specific skin conductance response and/or slow habituation. This trait tends to be reliable over time, and has been shown to be present in populations with schizophrenia, psychopathy, and anxiety disorders. Conversely, electrodermal stability describes individuals with few non-specific responses and fast habituation. Lability and stability both appear to have genetic links.
Output & Data Analysis
Electrodermal activity is commonly measured in micro-Siemens (μS; a measure of conductance). Various temporal and spectral features of EDA can be extracted and calculated.
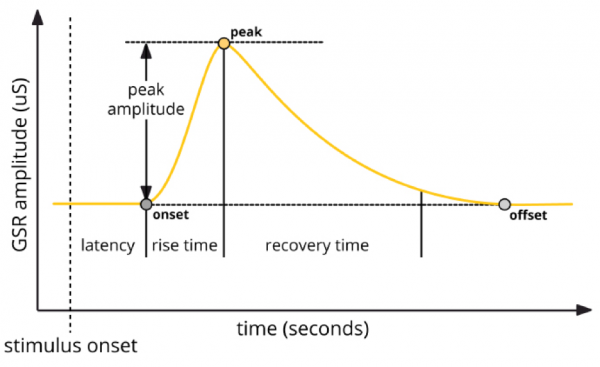
Generally, response peaks are of primary interest, as these typically occur in response to external stimulation. Latency refers to the time elapsed between stimulus onset and the beginning of the EDA peak, while rise time refers to the duration between peak onset and maximum amplitude. Recovery time describes the time elapsed between the maximum peak amplitude and the return to baseline. Peak magnitude/amplitude can also be measured.
More complex data can also be calculated and examined, including number of response peaks, peak amplitude, rise duration, peak area, accumulative EDA, and frequency power.
EDA response peak components (iMotions, 2017)
Signal Processing
Physiological data typically requires computational procedures and/or machine learning techniques for meaningful pattern extraction. A number of techniques are used when working with raw EDA data.
Since many EDA measurements are taken at a higher sample rate than required, downsampling is typically used to lower the sample rate. Data loss is not a significant risk when downsampling in this case.
When measuring biosignals, there is typically a need to remove noise from a measurement in order to increase the signal-to-noise ratio. For EDA, a basic median filter can be used to smooth the EDA data and remove the tonic component of the signal which is unrelated to the stimulus-response peaks.
Automatic detection algorithms can be used to identify peak amplitudes, onsets, and offsets using various thresholds.
Various software solutions exist to collect process EDA data, including iMotions Biometric Research Platform, BioPac AcqKnowledge, Ledalab and PsPM toolboxes for Matlab, and AdInstruments LabChart. The Society for Psychophysiological Research also hosts a software repository with a selection of programs for scoring EDA.
Applications & Uses
As mentioned in previous sections, EDA measurement is very common in psychophysical research, and is often used in tandem with other biosignal measures. Additionally, EDA measurements are used in clinical psychotherapy domains, consumer neuroscience and marketing, media and advertising testing, usability testing, user experience design, and emotional design.
Within psychophysical research domains, EDA measurement techniques are utilized within paradigms that present discrete stimuli (such as emotionally arousing images) and evaluate EDA response, as well as in paradigms that examine continuous skin response over time when engaging with a continuous stimulus, such as a video game. Measurements of EDA have been used to investigate stimulus-related psychophysiological phenomena, such as orienting, defensive, and startle responses, responses to affective and novel stimuli, habituation, and classical and operant conditioning. Cognitive psychology research uses EDA measurement to study emotional states, arousal, stress, human information processing, decision making, and memory. In personality psychology, EDA can be useful for studying both generalized personality traits (such as extraversion/introversion) and specific personality traits (such as sensitization, repression, and emotional lability).
More practical applications of EDA sensors include measurement of skin response in populations with anxiety, depression, schizophrenia, and other types psychopathology. EDA has also been used to study effects of pharmacological interventions in clinical psychology settings. Along with blood pressure, pulse, and respiration measurements, EDA is commonly measured in lie detector tests to assess deception.
In engineering psychology, human-computer interaction, marketing and product evaluation, EDA measurements are typically used to examine stress during task performance and emotional arousal in response to products or interactions.
Medical applications include the use of EDA measurements in dermatology—to assess skin pathology—and neurology—to assess damage to the central and peripheral nervous systems, such as brain lesions, degenerative diseases, and neuropsychological disorders such as agnosia.
The use of EDA measures and other biosensors can allow for non-invasive measurement of individuals of cognitive and affective states while not interrupting the performance of other tasks. This can allow for the development of affective computing systems that dynamically respond to users’ cognitive and affective state in real time. In many cases, feature extraction alone may be all that is required from EDA data; however, machine learning algorithms are useful when considering systems that need to adapt and respond to changing EDA measurements in real-time.
One notable affective computing application is Healey & Picard’s (1998) StartleCam, a wearable camera uses EDA data to determine startle responses. When a startle response is detected, images recently captured by the wearable camera are downloaded or transmitted to a web server, providing a technological metaphor for flashbulb memories.
EDA sensors have been used in number of musical applications. One notable example is Teresa Marrin Nakra’s (2000) Conductor’s Jacket, which collects gestural and physiological data from orchestral conductors during musical performances.
Knapp & Bortz’ (2011) MobileMuse is a custom hardware technology that can be linked to a mobile device for biometric emotion sensing that combines measurements of EDA with oximetry, temperature, and accelerometer sensors for gestural and emotional control of musical sound generation.
EDA sensors were also used in Müller et al.’s (2011) Skintimacy system to provide values to be mapped to sound variables in an interface for collaborative music performance.
With the rise of wearable technology, EDA sensors are also becoming more prevalent in fitness and wellness technologies, such as the Fitbit Sense, which utilizes an EDA sensor to measure stress levels. EDA sensors are particularly well-suited to wearable technology, given that they must be in physical contact with the skin. Sensors can also be embedded into clothing.
Further Reading
For those seeking a more detailed resource on this topic, Wolfram Boucsein (2012) has written an extensive book on electrodermal activity, describing the history of EDA measurement, underlying biological and electrical phenomena, measurement methods, and applications. A shorter primer on the topic by Dawson et al. (2016) provide a more condensed overview of EDA mechanisms and measurement.
Available Sensors & Specifications
This section lists a variety of EDA sensors from consumer electronics to open-source hardware to medical grade sensors. The best information on how to use each particular sensor can be found within the linked manuals and documentation.
| BioPac SS57LA | |
|---|---|
| Sources | BioPac 252.00 - 318.00 USD |
| Description | EDA Electrode Leads |
| Datasheet | None |
| Resources | BioPac Guide |
| Notes | Requires separate Biopac data acquisition and analysis hardware (much as the MP36, MP36R, or MP160 systems) compatible with Windows operating systems. The MP160 system also requires a separate electrodermal activity amplifier (EDA100C or EDA100D). Can be wireless using either the BioNomadic Logger or MP160 system). Biopac systems also include Biopac Student Lab (for the MP36 system) or AcqKnowledge (for the MP160 and MP36R systems) software for data acquisition and analysis. |
| Variants | SS57L |
| Biosignalsplux Electrodermal Activity (EDA) | |
|---|---|
| Sources | Biosignalsplux 95.00 EUR |
| Description | EDA Electrode Leads |
| Datasheet | Datasheet |
| Resources | User Manual |
| Notes | Requires biosignalsplux hub and electrodes for use. Can be used with OpenSignals (R)evoltion software (Windows/Mac OS/Linux/Android). |
| Variants | None |
| BITalino EDA Sensor | |
|---|---|
| Sources | BITalino 25.00 EUR |
| Description | Arduino-compatible EDA sensor |
| Datasheet | Datasheet |
| Resources | User Manual |
| Notes | None |
| Variants | None |
| Empatica E4 | |
|---|---|
| Sources | Empatica 1,690.00 EUR |
| Description | Wearable bracelet with sensors for EDA and other physiological phenomena |
| Datasheet | Datasheet |
| Resources | User Manual |
| Notes | Wireless (Bluetooth). Can be used with the E4 Realtime mobile application or the E4 Manager desktop application. |
| Variants | Empatica EmbracePlus |
| Infusion Systems BioEmo | |
|---|---|
| Sources | Infusion Systems 46.42 USD |
| Description | GSR impedance sensor |
| Datasheet | Technical Specifications can be found at Infusion Systems |
| Resources | User Guide |
| Notes | Wireless. Requires Infusion Systems I-CubeX Digitizer. |
| Variants | None |
| Mindfield Biosystems eSense Skin Response | |
|---|---|
| Sources | Mindfield Biosystems 149.00 EUR |
| Description | Skin conductance sensor which can send data through phone/tablet microphone jack |
| Datasheet | See User Manual (p. 49-50) for technical specifications |
| Resources | User Manual |
| Notes | Can be used with the Mindfield Biosystems eSense application (iOS/Android), the eSense web app, or user applications created with the eSense Software Developer Kit. |
| Variants | None |
| Movisens EdaMove 4 | |
|---|---|
| Sources | Movisens Price not listed. Request quote on website. |
| Description | Bluetooth sensor for collecting various physiological data |
| Datasheet | Datasheet |
| Resources | User Manual |
| Notes | Wireless (Bluetooth). Can be used with Movisens SensorManager/DataAnalyzer/DataMerger software (Windows) as well as the movisensXS Android app. Also measures three-dimensional acceleration, angular rate, atmospheric air pressure, among other phenomena. |
| Variants | EdaMove3 |
| Seeed Studio GSR Sensor | |
|---|---|
| Sources | Seeed Studio 9.90 USD |
| Description | Arduino-/Raspberry Pi-compatible GSR sensor |
| Datasheet | Brief technical specifications are available at Seeed Studio |
| Resources | User Guide |
| Notes | Arduino/Raspberry-Pi compatible. Measures resistance (not conductance). Requires Seeed Seeeduino-V4.2 and Base Shield for use. |
| Variants | None |
| Shimmer Sensing Shimmer3 EDA+ | |
|---|---|
| Sources | Shimmer Sensing 428.00 EUR |
| Description | Wireless GSR and pulse-sensing system |
| Datasheet | Datasheet |
| Resources | User Guide |
| Notes | Wireless (Bluetooth). No proprietary connectors. Open system also compatible with Shimmer software such as Consensys. |
| Variants | None |
References
- BIOPAC Systems Inc. (2021). Skin Conductance Response Analysis. https://www.biopac.com/ application/electrodermal-activity/advanced-feature/skin-conductance-response-analysis/
- Boucsein, W. (2012). Electrodermal Activity (2nd ed.). Springer US. https://doi.org/10.1007/978-1-4614-1126-0
- Braithwaite, J. J., Watson, D. G., Jones, R., & Rowe, M. (2013). A Guide for Analyzing Electrodermal Activity (EDA) and Skin Conductance Response (SCRs) for Psychological Experiments. https://www.biopac.com/wp-content/uploads/EDA-SCR-Analysis.pdf
- Dawson, M. E., Schell, A. M., & Filion, D. L. (2016). The electrodermal system. In Cacioppo, J. T., Tassinary, L. G., Berntson, G. G. (Eds.), Systematic Psychophysiology (pp. 217-243). Cambridge University Press. https://doi.org/10.1017/9781107415782.010
- Edelberg, R. & Burch, N. R. (1962). Skin resistance and galvanic skin response. Archives of General Psychiatry, 7(3), 163-169. https://doi.org/10.1001/archpsyc.1962.01720030009002
- Electrodermal activity (2021, February 13). In Wikipedia. https://en.wikipedia.org/wiki/Electrodermal_activity
- Essl, G. & Won Lee, S. (2018). Mobile devices as musical instruments - State of the art and future prospects. In International Symposium on Computer Music Multidisciplinary Research. (pp. 525-539). Matosinhos, Portugal. https://doi.org/10.1007/978-3-030-01692-0
- Healey, J. & Picard, R. W. (1998). StartleCam: A cybernetic wearable camera. In Digest of Papers, International Symposium on Wearable Computers. (pp. 42-49). Pittsburgh, USA. https://doi.org/10.1109/ISWC.1998.729528
- iMotions (2017). Galvanic Skin Response: The Complete Pocket Guide. https://imotions.com/guides/eda-gsr/
- Knapp, R. B., & Bortz, B. (2011). MobileMuse: Integral music control goes mobile. In Proceedings of the International Conference on New Interfaces for Musical Expression. (pp. 203-206). Oslo, Norway. http://doi.org/10.5281/zenodo.1178073
- Marrin Nakra, T. (2000). Searching for meaning in gestural data: Interpretive feature extraction and signal processing for affective and expressive content. In Wanderley, M. M. & Battier, M. (Eds.). Trends in Gestural Control of Music (pp. 415-438). Paris: IRCAM, Centre Pompidou
- Miranda, E. R. & Wanderley, M. M. (2006). Biosignal interfaces. In Miranda, E. R. & Wanderley, M. M. (Eds.), New Digital Musical Instruments: Control and Interaction Beyond the Keyboard (pp. 173-217). A-R Editions.
- Müller, A., Fuchs, J., & Röpke, K. (2011). Skintimacy: Exploring interpersonal boundaries through musical interactions. In Proceedings of the International Conference on Tangible and Embedded Interaction. (pp. 403-404). Funchal, Portugal. https://doi.org/10.1145/1935701.1935801
- Nourbakhsh, N., Chen, F., Wang, Y., & Calvo, R. A. (2017). Detecting users’ cognitive load by galvanic skin response with affective interference. The ACM Transactions on Interactive Intelligent Systems, 7(3), Article 12. https://doi.org/10.1145/2960413
- Picard, R. W. (1997). Affective Computing. The MIT Press.
- Sharma, M., Kacker, S., & Sharma, M. (2016). A brief introduction and review on galvanic skin response. International Journal of Medical Research Professionals, 2(6), 13-17. https://doi.org/10.21276/ijmrp.2016.2.6.003
- Van Dooren, M., de Vries, J. J. G., & Janssen, J. H. (2012). Emotional sweating across the body: Comparing 16 different skin conductance measurement locations. Physiology & Behavior, 106(2), 298-304. https://doi.org/10.1016/j.physbeh.2012.01.020
- Westyn, T., Presti, P., & Starner, T. (2006). ActionGSR: A combination galvanic skin response-accelerometer for physiological measurements in active environments. In Proceedings of the IEEE International Symposium of Wearable Computers. (pp. 129-130). Montreux, Switzerland. https://doi.org/10.1109/ISWC.2006.286360
- Yuksel, B. F., Oleson, K. B., Chang, R., & Jacob, R. J. K. (2019). Detecting and adapting to users’ cognitive and affective state to develop intelligent musical interfaces. In Holland, S., Mudd, T., Wilkie-McKenna, K., McPherson, A., & Wanderley, M. M. (Eds.). New Directions in Music and Human-Computer Interaction (pp. 115-120). Springer Nature. https://doi.org/10.1007/978-3-319-92069-6_11
- Zhou, F. & Jianxin Jiao, R. (2013). Eliciting, measuring, and predicting affect via physiological measures for emotional design. In Fukuda, S. (Eds.), Emotional Engineering vol. 2 (41-62). Springer, London. https://doi.org/10.1007/978-1-4471-4984-2_4

